
POP, or playoff output projection, is an NHL metric I created in the summer of 2014 for gambling purposes to better assess a team’s true talent level, specifically with regards to how they would perform in the playoffs. A full explanation and calculation can be found here, which has since been updated with score-adjusted metrics.
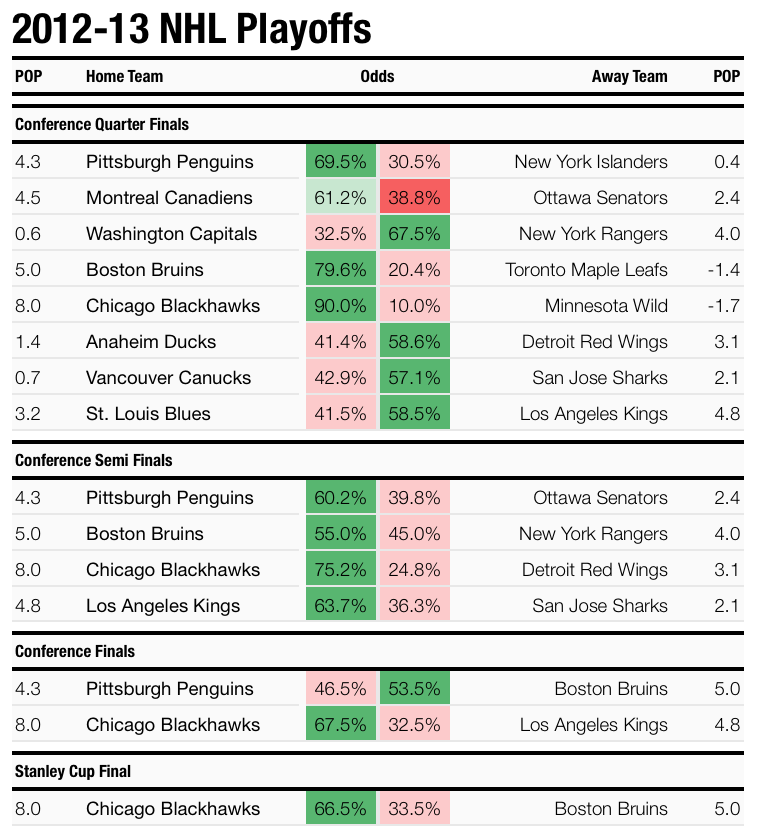
Here is a full list of every team’s POP since 2007-08, along with a playoff bracket with series odds (home ice advantage is not considered) according to POP.
Playoff series odds are derived from a team’s true winning percentage based on a regression between POP and regulation winning percentage and then using BillJames’ Log5 formula to find win probability between both both teams in a single game.


2 thoughts on “POP”